The Office for Health Improvement and Disparities (formerly Public Health England) has published a refreshed Vision profile detailing eye health data up to 2021/22. This updated profile provides a useful tool for clinicians to compare patient profiles and unit performance across a range of metrics, compare that to regional and national data and potentially make the case for the appropriate resourcing of their ophthalmology services.
Overview of Vision profile
The Vision profile data is held on the Office for Health Improvement and Disparities (OHID’s) ‘Fingertips’ public health database. Fingertips is a set of national public health profiles across a range of clinical areas and diseases.
Data held within the Vision profile is effectively an update to the ‘Vision Atlas’ published in 2021 under a similar public health profiling system but under a different name, which we updated you on at the time.
The refreshed profile brings together 32 indicators across the eye care pathway, including demographic risk factors such as smoking and diabetes, sight loss outcomes for glaucoma, diabetic eye disease, and AMD as well as updates to the headline hospital episode statistics covering:
- Outpatient attendances
- Cataract surgery
- Intravitreal injections
- Retinal detachments
The tool provides a national overview as well as allowing you to compare the above indicators across English regions, Integrated Care Board (ICB) sub-locations, districts, counties and unitary authorities. Some indicators such as risk factors have comparative yearly data going back to 2010/11, while some newer indicators such as sight loss outcomes for AMD only go back to 2020/21. Not all indicators are available at different geographic levels.
This tool can potentially help support ICBs, commissioners, clinical leads and clinicians in identifying the key issues in your area and provide evidence that can support decision-making on the resourcing needed to deliver effective patient care. We encourage you to explore the data, share with your colleagues and see how your area compares.
Key themes
While the latest available data in this profile is from 2021/22 so does not include the last 18 months of activity, it still allows us to usefully drill down into key trends.
Outpatient attendances recovering but long backlogs remain
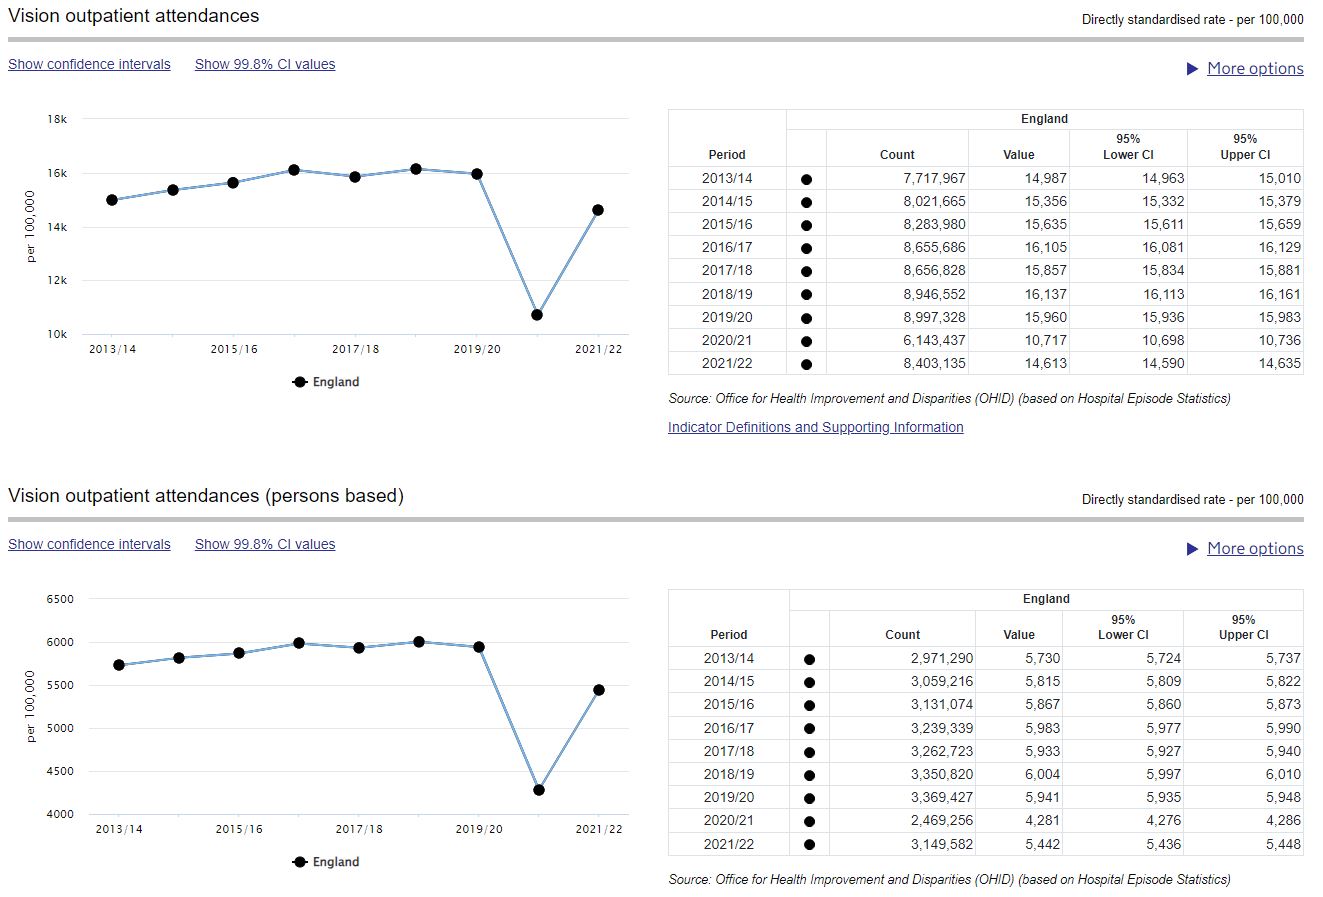
Vision outpatient attendances plateaued in the three years leading up to the COVID-19 pandemic, before dropping significantly because of the shutdown of routine outpatient care during the pandemic. The latest data confirms what we knew at the time – that in 2021/22 eye care services were unable to deliver pre-pandemic levels of outpatient care.
Outpatient backlogs therefore remain a key challenge in ophthalmology. Our 2022 workforce census found three-quarters (74%) of eye units had become more concerned about the impact outpatient backlogs were having on patient care, with a quarter (26%) estimating it would take over three years to clear. We are therefore calling on policymakers to prioritise initiatives to rapidly expand ophthalmology outpatient capacity, including:
- More integrated data sharing across optometry and ophthalmology through a national electronic eyecare referral system, interoperable electronic patient records and standardised ophthalmic imaging
- Support for ophthalmology services in the rollout of community diagnostic centres
- Supporting wider eye care professionals to work at the top of their license, including independent prescribing for orthoptists
To secure long-term NHS capacity however, the Government must deliver on its pledge in the Long Term Workforce Plan for England to increase specialty training places in line with the increases in medical school places, to secure the pipeline of trainee ophthalmologists needed to keep pace with ever-rising patient need. Equivalent long-term commitments are needed too in Scotland, Wales and Northern Ireland.
While outpatient capacity remains challenging, the Vision profile highlights how surgical capacity has been able bounce back from the pandemic.
Hospital admissions for procedures recovered quickly
Admissions to hospital for cataract surgery, retinal detachment surgery, and intravitreal injection therapy recovered to above pre-pandemic levels in 2021/22:
| Procedure | 2019/20 (Pre-pandemic) | 2021/22 (Post-pandemic) |
| Cataract surgery | 383,860 | 409,346 |
| Retinal detachment surgery | 10,630 | 10,925 |
| Intravitreal injection therapy | 607,635 | 677,409 |
Increased surgical activity is welcome, aided by initiatives such as surgical hubs and high-throughput cataract hubs. NHS eye units must be supported in continuing to ensure sufficient surgical capacity is maintained to keep surgical backlogs down while we focus more strongly on tackling backlogs in outpatient care.
Regional comparison highlights variation in outcomes
Vision profile data detailing sight loss outcomes also paints a complex picture of the variation in eye care across different regions in England.
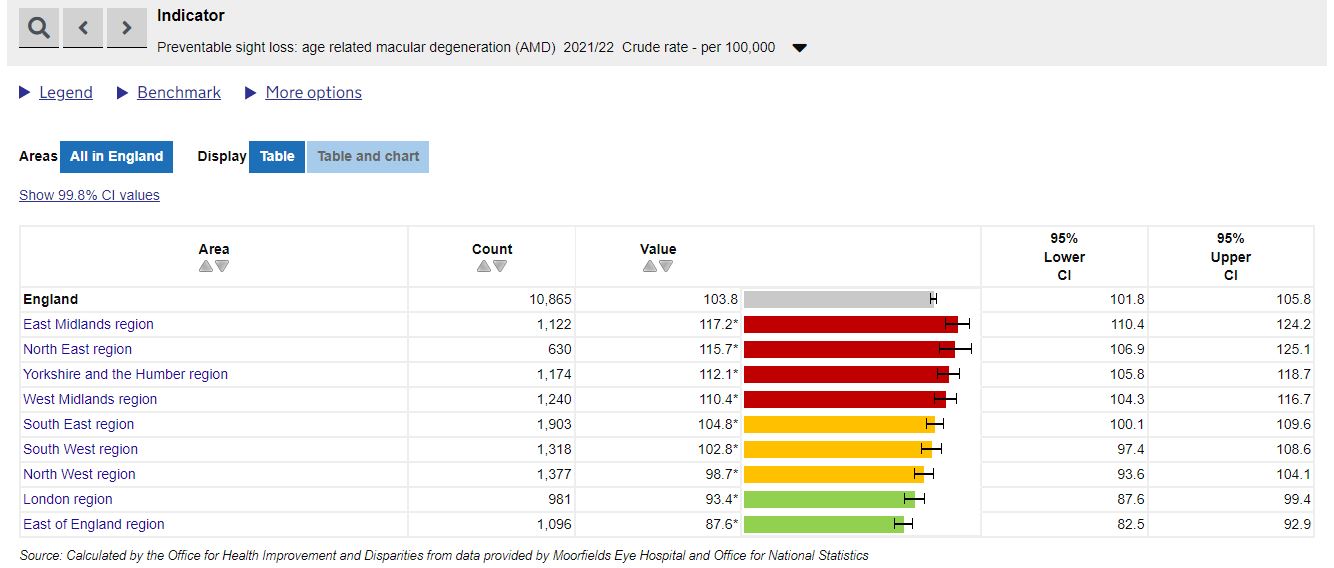
Variation exists between regions, where for example the rate of sight loss due to age related macular degeneration (AMD) is highest in the East Midlands at 117 per 100,000 population. That drops to 88 per 100,000 in the East of England, both of which vary significantly from the average across England of 104 per 100,000.
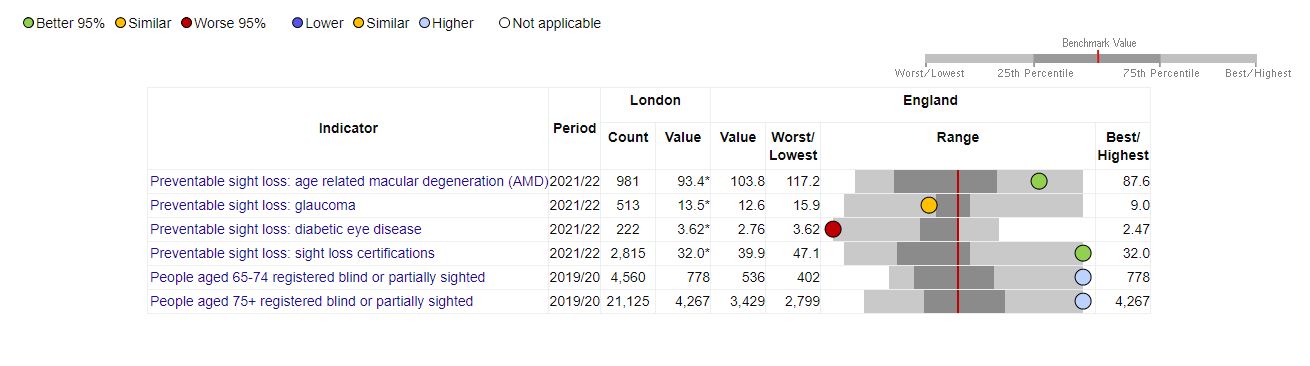
Variation exists within regions too, where for example the London region has the lowest proportion of preventable sight loss certifications overall, it also has the highest proportion of sight loss from diabetic eye disease.
This also demonstrates why data from the profile should not be used as an indicator of ‘success’ or ‘failure’, as each region has its own unique patient demographics and resources. This tool should instead be used to assess the challenges posed to individual areas, place them within a wider context and support efforts to provide the appropriate resourcing.
Utility of the Vision profile
The main utility of the Vision profile is to help local clinicians understand the population and patient profile in their area, and therefore what resources they need to deliver high quality care.
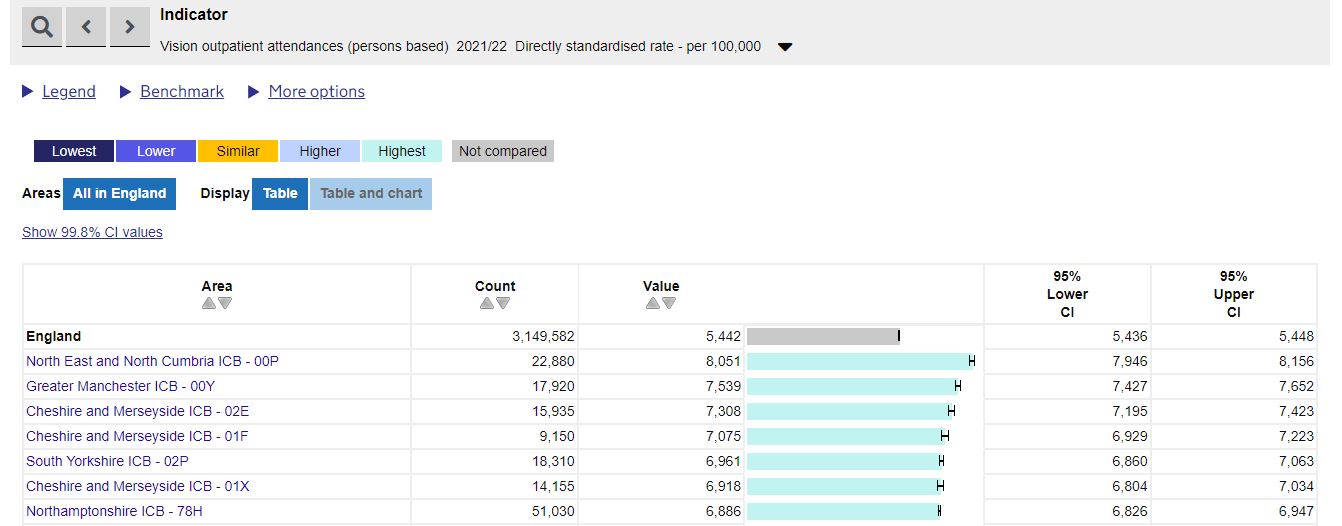
For example, North East and North Cumbria ICB – 00P (formerly NHS Sunderland CCG) has the greatest proportion of their population attending vision outpatient appointments than any other location. This should help local clinicians in the region evidence the volume of patients they see, and the support they need to deliver outpatient capacity.
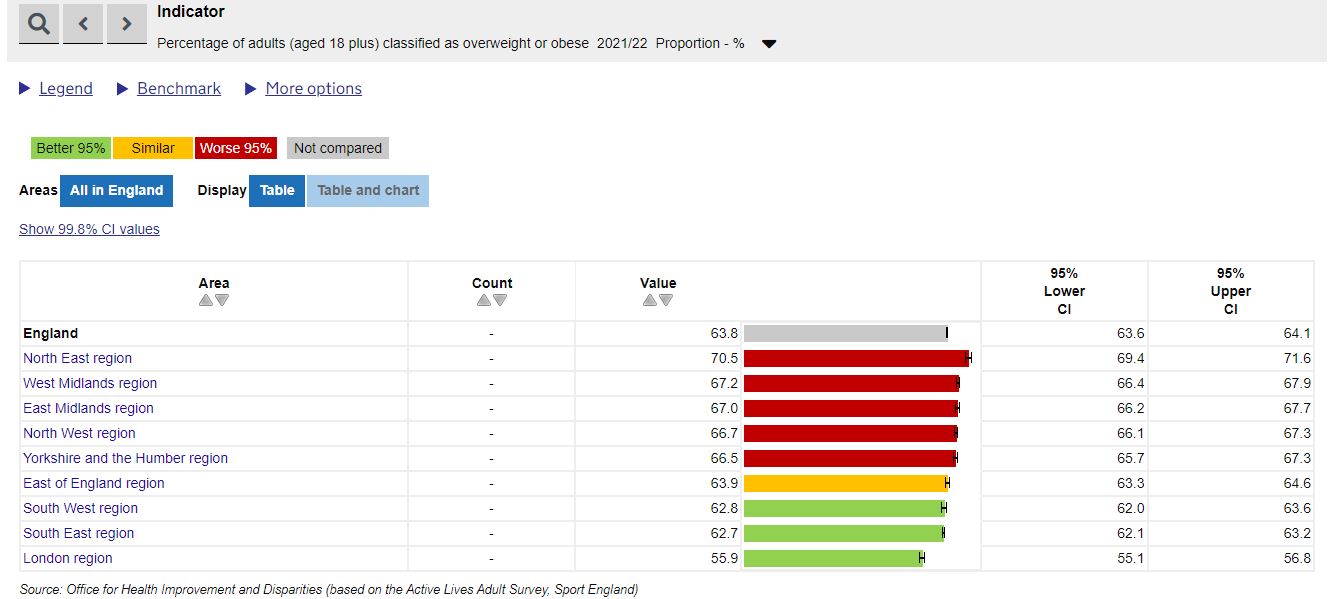
Similarly, the North East region also has the highest proportion of their population classified as overweight or obese. This may help local clinicians make the case for the support needed for services such as diabetic eye screening.
We therefore encourage you – particularly clinical leads – to explore the data provided in the updated Vision profile. This may help you assess the wider context of the challenges faced by your unit, and using this data will help evidence your business cases or during stakeholder engagement.
If you have questions regarding the Vision profile, please contact [email protected].